You have a PLC, a power meter, or a sensor that speaks Modbus TCP, and what you actually want is not a register table, it is a number on a screen that moves when the real one does. This walkthrough gets you from a bare Modbus TCP connection to a live dashboard tile in ControlBird Community Edition, the self-hosted edition, free for personal use, in about ten minutes once your device is reachable on the network.
In This Article
- What you'll need
- Step 1: turn on the Modbus service
- Step 2: connect your device and define what to read
- Step 3: confirm the value is live
- Step 4: put it on a dashboard
- If the numbers look wrong
- The bottom line
What You'll Need
Most Modbus walkthroughs stop at proving you can read one register with a tool like QModMaster, or hand you a Node-RED flow to wire up yourself. Both are legitimate tools, and if you already have a Node-RED pipeline running, there is no reason to tear it out. This walkthrough covers the connection, the live value, and the dashboard tile in one pass, in ControlBird, the platform we build.
Before you start, you will want:
- A running ControlBird node. Community Edition is self-hosted and free for personal use; one line gets a node running:
curl -fsSLO https://controlbird.io/compose.yaml && docker compose up -d - A Modbus TCP device to connect to. A real PLC, power meter, or sensor works. If you do not have one handy, a free Modbus TCP simulator such as diagslave running on the same machine works just as well for following along.
- The device's register map. Which register holds the value you want, and what data type it is. This normally comes from the manufacturer's documentation or your PLC program.
- About ten minutes, plus however long it takes to track down that register map.
Step 1: Turn On the Modbus Service
Modbus is one of the protocols included in Community Edition, alongside MQTT, HTTP, CoAP, OPC UA, and SMTP. Like every protocol, it ships as an extension rather than something bolted permanently into the core, so the first time you use it you install it once.
Open the Extensions app, search for "Modbus," and open the Modbus Service tile. Click Install. The status moves from Installing to Provisioning to Installed, and the tile updates on its own, no page reload needed. If Modbus is already installed from an earlier session, skip this step.
Step 2: Connect Your Device and Define What to Read
Open the Device Manager app. A generic Modbus TCP device usually has no prebuilt integration template (those exist for named products, like a specific thermostat or PLC brand), so use Create Custom Device rather than Add Integration. That opens a five-step wizard.
- Protocol. Select Modbus TCP from the tile grid.
- Configure. Name the device, then fill in the connection fields: Host (your device's IP address), Port (502 by default), Unit ID (1 by default, unless your device uses a different slave address), plus connection and operation timeouts if the defaults do not fit your network.
- Points. Add a point for each value you want to read. Give it a name, a value type (Float, Int, Bool, or String), and a direction (Read to poll the device, Write to push a value out). Then fill in the Modbus-specific fields pulled straight from your register map: Register Type (Coil, Discrete Input, Input Register, or Holding Register), Address, Register Count, Byte Order, and Word Order. For a temperature reading stored as a 32-bit float across two input registers starting at address 0, that is Register Type: Input Register, Address: 0, Register Count: 2, Byte Order: Big Endian.
- Nodes. Pick which node runs the connection. A single-node Community Edition install only has one to choose.
- Review. Check the summary and click Create Device.
If the value you are reading is a numeric measurement rather than an on/off state, it belongs on an input or holding register, not a coil. Coils and discrete inputs are single bits and can only carry Bool values.
Step 3: Confirm the Value Is Live
Once the device is created, select it in the Device Manager tree. The points table lists every point you defined, with a Value column that updates in real time as the controller polls the device: no manual refresh, no browser reload.
If the value shown looks like nonsense (a huge or negative number where you expected a normal reading), the cause is almost always mismatched byte or word order rather than a broken connection. See the troubleshooting note below before assuming the device is unreachable.
Step 4: Put It on a Dashboard
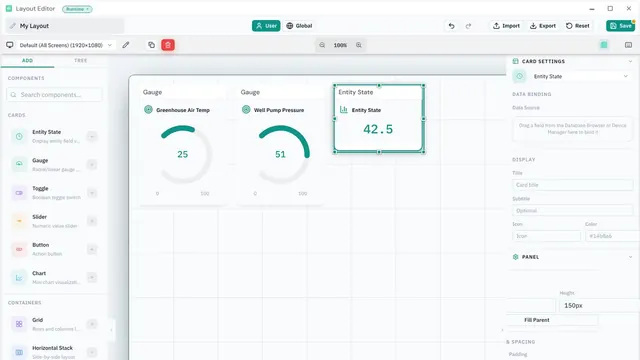
Open the Layout Editor app, ControlBird's drag-and-drop dashboard and desktop designer. This is where the register you just connected turns into something you would actually look at.
Drag a Gauge card (or an Entity State card, if you would rather see a plain number) from the component palette onto the canvas. With the card selected, open its properties panel and find the Data Binding section. Drag the point from the Device Manager's points table and drop it there. That binds the card to the live field directly, no entity IDs or field paths to type in by hand.
Save the layout, and the gauge starts moving with the real device. Add a Toggle or Slider card the same way for any point you configured as writable.
If the Numbers Look Wrong
The most common cause of a scrambled value is byte or word order, not a bad connection. Try toggling Word Order to Low Word First for 32-bit and 64-bit values (word order only matters when Register Count is greater than 1). If that does not fix it, turn on Logging on the endpoint to inspect the raw bytes going back and forth, and double-check that the Unit ID matches the address your device actually responds to.
If you are not sure which address holds which value, look for a document called a "Modbus register map" or "point list" from the manufacturer, or check your PLC program directly. ControlBird will faithfully read whatever address you point it at; it has no way to know what that register means on your specific device.
For the complete field reference, function codes, and known limitations (RTU is client-only, the server side is poll-only, and so on), see the Modbus TCP/RTU guide.
The Bottom Line
Connecting a Modbus device and putting its value on a dashboard is not a project that needs an integrator. In Community Edition it is an extension install, a five-step wizard, and a drag-and-drop card, all free for personal use.
If your setup grows past a single device, alarms, history, or a larger site change the picture. See how the same Modbus connection pattern feeds alarms for a water utility, or how ControlBird compares to Ignition if you are weighing a heavier SCADA platform for a larger deployment.
Get Started with ControlBird
Deploy your first instance in under two minutes. ControlBird is free for personal use.
Explore the Docs →