Step 9: View Historical Data
Query time-series data and analyze trends with the Historian app.
Full reference
For complete details, field tables, and limitations, see the Historian reference.
Why Historical Data Matters
Real-time monitoring tells you what's happening now, but historical data answers the questions that matter most: "What happened overnight?" "Is this temperature normal for this time of day?" "When did the problem start?"
The Historian app stores time-series data from your devices and lets you query it with flexible filters.
Opening the Historian
Click the ControlBird logo in the taskbar and select Historian. The app opens with a split view: tables on the left, query results on the right.
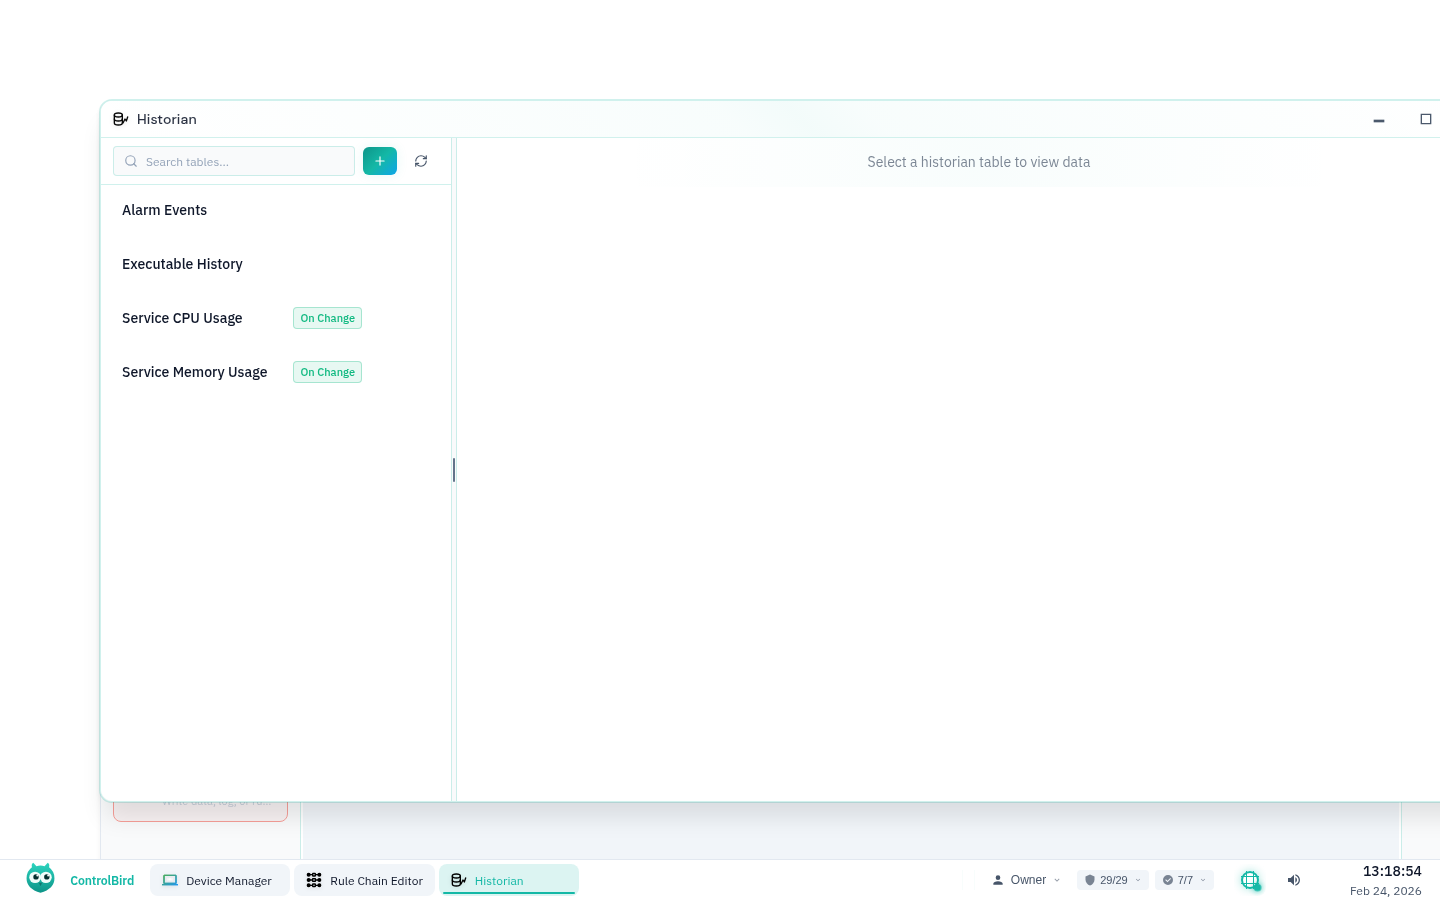
Understanding Historian Tables
A Historian Table is a collection of time-series records for a specific type of data. ControlBird automatically creates tables when you configure data collection, or you can create custom tables for specific use cases.
What Each Record Contains
| Column | Description | Example |
|---|---|---|
| Timestamp | When the value was recorded | 2024-01-15 14:32:05.123 |
| Entity | Which device or entity the value belongs to | Temperature Sensor |
| Value | The recorded measurement | 72.5 |
| Quality | Data quality indicator (Good, Bad, Uncertain) | Good |
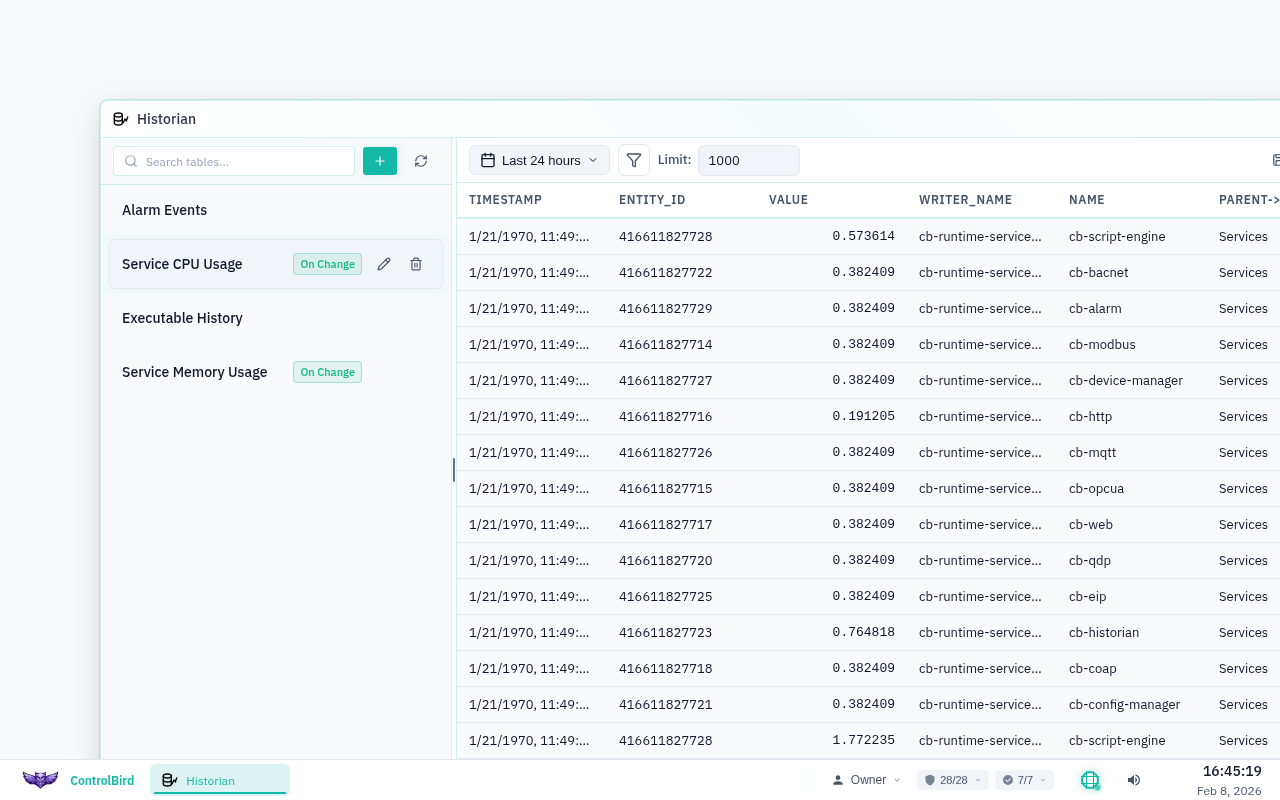
Querying Historical Data
Select a table from the left panel to see its data. The query view lets you filter and explore records.
Basic Query
- Click a table name in the left panel (e.g., "Temperature Readings")
- The right panel shows recent records automatically
- Use the time range picker to narrow down the results
Time Range Options
Filtering by Entity
If a table tracks multiple entities (e.g., all temperature sensors), you can filter down to a single one:
- Click the Entity Filter dropdown
- Select the specific entity you want to examine
- Results update to show only that entity's data
Keyboard Shortcut
Press Ctrl+F in the Historian to open the quick filter. Type an entity name to jump directly to its data.
Reading the Results
Query results appear as a table with timestamps, values, and quality indicators. Here's how to interpret what you see:
Creating Charts
Numbers in a table are useful, but charts reveal trends instantly. To visualize your data:
- Select a table and apply your desired filters
- Click the Chart button in the toolbar
- Choose the chart type (line, bar, area)
- The chart appears showing values over time
Best for continuous values like temperature
Best for discrete events or counts
Shows cumulative values over time
Common Use Cases
Troubleshooting
"The alarm triggered at 3 AM - what happened?" Use the Historian to look at the exact values leading up to and during the event.
Trend Analysis
"Is my energy consumption increasing over time?" Chart weekly data to spot gradual changes that aren't obvious day-to-day.
Performance Verification
"Did my new automation work?" Compare before/after data to confirm your changes had the intended effect.
Reporting
"What were the average temperatures last month?" Export data or use aggregation queries for summaries.
Data Retention
Historian tables have configurable retention periods. When data exceeds the retention limit, the oldest records are automatically removed. This keeps storage manageable while preserving the data you need.
Retention Settings
Default retention is typically 30 days. You can adjust this per table in the Historian settings, or contact support for extended retention on higher-tier plans.
Troubleshooting
No data appears for my table
Check these common causes:
- Time range: Make sure your selected range includes when data was collected
- Data collection: Verify the device is connected and sending data
- Table configuration: Confirm the table is configured to collect from your entities
Data has gaps or missing periods
Gaps typically indicate:
- Device offline: The device lost connection during that period
- Network issues: Data couldn't reach ControlBird
- Polling interval: Data is only collected at configured intervals, not continuously
How do I export data?
After running a query, click the Export button in the toolbar. You can download data as CSV for use in spreadsheets or other analysis tools.